 From research targeted instruments like the EIT16 to fully customized OEM products for bioanalytical, medical and industrial applications Sciospec provides highly specialized solutions for electrical impedance tomography. Flexible channel configurations, frequency sweep modes, scalability up to several hundred channels and broad options for extension through sensor adapters, add-on modules and more make Sciospec EIT systems suitable for a multitude of ambitious applications.
EIDORS (Electrical Impedance Tomography and Diffuse Optical Tomography Reconstruction Software) is a free software for EIT image reconstruction and processing. EIDORS is based on MATLAB, but also works with the free open source alternative Octave and is broadly used and supported by the academic community and EIT experts worldwide. The Sciospec EIT16 – 16 channel EIT device – is a full featured high bandwidth EIT system for ambitious research applications. The EIT data generated using a Sciospec EIT system, like the EIT16, and corresponding Sciospec software can be imported, processed and visualized in the Matlab based free software EIDORS. Sciospec provides appropriate Matlab code examples and guidance to help you getting started with this constellation. This Application Note demonstrates how to import and perform EIT image reconstruction in EIDORS using the Matlab code provided by Sciospec. Some sample data were generated in a standard phantom experiment using the Sciospec EIT16 and corresponding Sciospec software.
Generate measurement data
Necessary equipment for the performance of an EIT measurement:
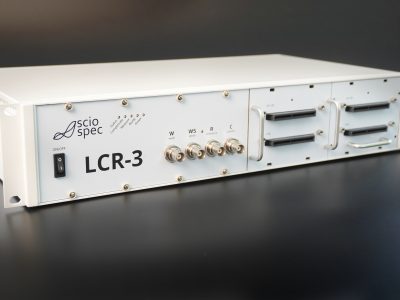
- Sciospec EIT system, e.g. the 16 channel EIT system (EIT16). This includes:
- EIT16 device
- Sciospec software
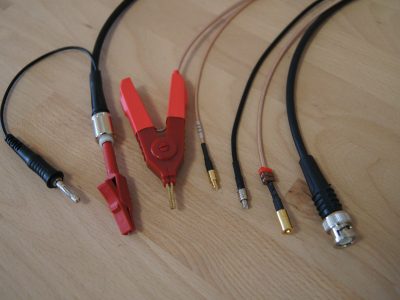
- 16 measurement cables (16 standard Sciospec MCX-to-banana-plug cables and 16 alligator clips)
- power supply
- USB cable
- Sciospec standard phantom tank
- PC
- water
- object, e.g. hollow glass cylinder (insulting object)
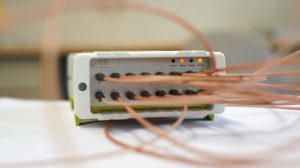
The Sciospec standard EIT phantom tank has a diameter of 20 cm, height of 15 cm and 16 stainless steel electrodes arranged on one level around the tank. The phantom were filled with 2.5 l tap water. Note: Water with a precise salt content can be obtained by using deionised water and adding the desired amount of NaCl or other salts. Every electrode was connected in counter-clockwise to the Sciospec EIT16 device using a standard Sciospec MCX-to-banana-plug cable set, as shown in Figure 1.
The EIT systems and the standard EIT phantom tank are available on product page. Check out the page or contact us directly for more information or requests. Phantom tanks with alternative electrode configurations and diameters are available on request.


The measurement parameters were set in the Sciospec software as shown in Figure 3:
- frequency: 1 point at 100 kHz
- amplitude: 10 mA
- current source: DC
- frames per second: 30


First the phantom filled with tap water without any object was measured to obtain the ‘reference’ data. By adding a insulting object (in this case: hollow glass cylinder, diameter 3 cm) and move it inside of the phantom the ‘anomaly’ data was produced.
The datasets can be easily exported by selecting them and pressing the save-button as shown in Figure 4. The files were stored in the selected directory including a number and with the file extension ‘.eit’.

This AppNote only deals with usage of the EIT data in EIDORS (//eidors3d.sourceforge.net/). The visualization can also be done directly in the Sciospec software. The received difference image for the 36th frame is shown below. Please refer to the EIT manual for further description of the Sciospec software.
Import, process and visualize the data in EIDORS
EIDORS (Electrical Impedance Tomography and Diffuse Optical Tomography Reconstruction Software) is a free Matlab based software to process and visualize EIT data. This part shows the procedure of how to use the Matlab code to import ‘.eit’-files generated using the Sciospec software and process and visualize some sample datasets. Sciospec provides all files needed to redo the procedure shown in this application note on request.
Please contact Sciospec Scientific Instruments for access to the Matlab code and sample datasets.
The provided folder includes three Matlab files:
- ‘fnc_read_Sciospec.m’
- ‘func_ConvertSciospecToEIT.m’ and
- ‘Main_SciospecData_with_eidors.m’.
Guideline to import, process and visualize EIT data using the provided Matlab code and the sample datasets:
- start Matlab
- open the code ‘Main_SciospecData_with_eidors.m’ → this should look like Figure 6
- start-up EIDORS by enter the appropriate file path to EIDORS in line 2 of the code
- configure the measurement paths for ‘Reference’ and ‘Anomaly’ data in line 7 and line 19
- run the Matlab script (‘Run’-button in the menu bar)
Note: If you use different datasets than the sample datasets in this application note: configure the whole code (code snip shown in Figure 7) to your datasets in step 4.


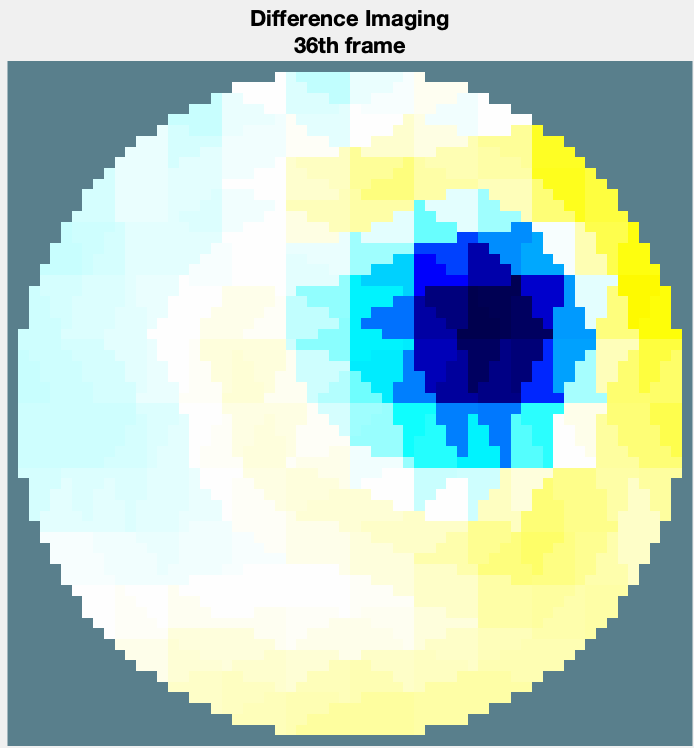 After running the Matlab script the time-difference EIT imaging will be displayed from 1th to 180th frame. The 36th frame of the difference imaging is shown in Figure 8. The imaging shows the color-coded conductivity change over time. White colored areas have no conductivity change compared to the reference salty water. Blue color indicates the areas where its conductivity decreased relative to the reference. In this example an insulating glass object was used and therefore is shown in blue coloration. Areas where conductivity increased compared to the reference data are displayed in red coloration.
A video for the entire process of importing data into Matlab and processing data using EIDORS is shown in video 1.
Conclusion
In this application note the entire process of generating measurement data using a Sciospec EIT system (like the EIT16), import, process and visualize the data in EIDORS was presented. The Matlab code provided by Sciospec can also be used to import other ‘.eit’ datasets.
Sciospec is specialized in creating customized solutions and can offer solutions both as lab-bench type products or OEM modules to be integrated into your application. We also offer our know how as service to help you kick-start your application. Don´t hesitate to ask us for help.
References

- Category: application note
- Tags: EIDORS , EIT , imaging , Impedance Tomography , MATLAB , phantom experiment , real-time image reconstruction , Sciospec EIT16 , Tank Experiment